Which Insurance Company Has the Most Complaints? Here’s What the Data Shows

Which insurance company has the most complaints? It depends on how you measure it — and that distinction matters a lot.
Here’s a quick answer based on regulatory data:
| Insurer | NAIC Complaint Index | Key Data Point |
|---|---|---|
| Liberty Mutual | 2.86 | Nearly 3x the national average |
| The Hartford | 1.54 | Above average |
| Allstate | 1.10 | Slightly above average |
| USAA | 1.18 | Slightly above average |
| State Farm | 0.79 | Below average (but most raw complaints) |
| Progressive | 0.71 | Below average |
| GEICO | 0.69 | Below average |
| Farmers | 0.86 | Near average |
Important: The NAIC Complaint Index uses 1.0 as the national baseline. A score above 1.0 means more complaints than expected for that company’s size. A score below 1.0 means fewer.
So while State Farm receives the highest number of raw complaints — 231 for auto alone in one dataset — its complaint index is relatively low because it insures more drivers than almost anyone else. Liberty Mutual, by contrast, has far fewer raw complaints but a disproportionately high rate per customer.
Raw complaint volume is misleading. The complaint ratio is what tells you whether your insurer is actually underperforming.
This matters because insurance companies collect roughly $1 trillion in premiums annually in the U.S. When things go wrong — a delayed claim, a denied payout, a lowball settlement offer — knowing which companies have a track record of problems can help you avoid a costly mistake before you ever need to file a claim.
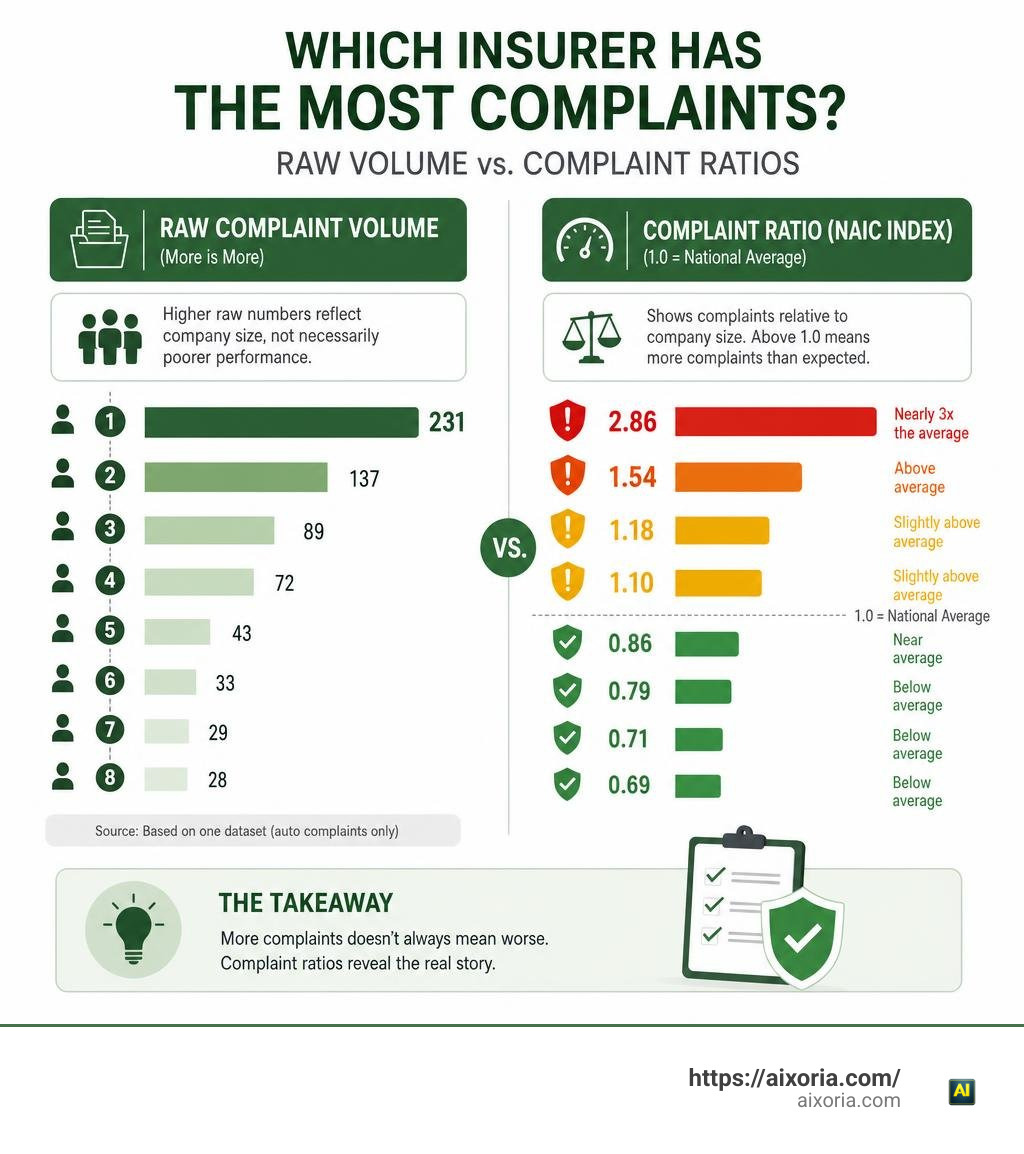
Understanding the Metrics: Raw Complaint Volume vs. Complaint Ratios
When we look at consumer dissatisfaction in the insurance industry, we have to look past the surface. If you only look at total, raw complaint numbers, the largest insurance carriers in the country will always look like the worst offenders. Because they cover tens of millions of policyholders, they naturally generate a higher volume of phone calls, emails, and regulatory filings.
To create a level playing field, state regulators and the National Association of Insurance Commissioners (NAIC) look at market share, earned premiums, and earned exposures.
- Market Share: The percentage of total industry premiums written by a single company.
- Earned Premiums: The amount of premium an insurer has “earned” by providing coverage for a specific period.
- Earned Exposures: The actual number of individual risks (like a single car or a single home) covered over a year.
By dividing a company’s share of total complaints by its share of total premiums, we get a normalized metric. This allows us to compare a massive national corporation with a small regional provider. For a deeper look at how these metrics are normalized into composite quality scores, researchers often study the Top 10 US Insurers by NAIC-Recorded Complaint Index Composite, which balances complaint indices with claim-denial rates.
How the NAIC Complaint Index Answers: Which Insurance Company Has the Most Complaints?
The NAIC Complaint Index is the gold standard for measuring how frequently an insurer’s customers run into serious issues. The index is built on confirmed, closed consumer complaints. These are not just casual grievances; they are complaints that state insurance departments have investigated and found to have legal or contractual merit.
The baseline score is always set at 1.0.
- An index of 2.0 means the company receives twice as many complaints as expected for its size.
- An index of 0.5 means it receives half the expected number of complaints.
By tracking these scores, we can identify which carriers consistently treat their policyholders fairly. For example, looking at how national carriers stack up reveals that some household names maintain incredibly clean records. You can explore how the cleanest options compare in the NAIC ranks auto insurers with the cleanest records | CarInsurance.com report. If you are shopping for a new policy and want to prioritize a smooth claims process, aligning this data with our guide on the Most Reputable Car Insurance Companies in 2026 – Top 10 Ranked is a smart place to start.
National vs. Regional Insurer Complaint Disparities
A fascinating trend emerges when comparing national insurance giants with smaller regional carriers. Large national insurers benefit from massive premium volumes, which can dilute their overall complaint ratios. If an insurer writes $10 billion in premiums, even a few hundred confirmed complaints will keep their index well below 1.0.
Regional carriers, however, experience high exposure volatility. Because their customer base is concentrated in specific geographic regions, a single localized event — like a severe hailstorm in the Midwest or a wildfire in the West — can cause complaints to spike.
Furthermore, major national brands often operate through dozens of different underwriting subsidiaries. For example, State Farm operates through State Farm Mutual Automobile Insurance Company, State Farm Fire and Casualty Company, and State Farm General Insurance Company. Each of these subsidiaries has a completely different complaint profile. A consumer might buy a policy thinking they are getting a highly rated national brand, while their actual underwriting subsidiary has a disproportionately high complaint index.
Which Insurance Company Has the Most Complaints?
To understand who the worst offenders are, we must look at both national databases and state-specific reports. Nationally, carriers like Liberty Mutual, Farmers, and certain tech-focused niche brands consistently show elevated complaint ratios relative to their market size.
The table below highlights how several major insurers compare across different lines of business using recent data:
| Insurance Carrier | Line of Business | Complaint Index / Ratio | Performance Context |
|---|---|---|---|
| Liberty Mutual | Auto | 2.86 (NAIC) | Nearly three times the national average |
| Allstate | Auto | 1.10 (NAIC) | Slightly worse than the national average |
| Farmers Insurance | Auto | 0.86 (NAIC) | Slightly better than the average |
| State Farm Mutual | Auto | 0.79 (NAIC) | Well below average, despite high raw volumes |
| Progressive | Auto | 0.71 (NAIC) | Strong performance relative to its massive size |
| GEICO | Auto | 0.69 (NAIC) | Highly rated for low relative complaint volume |
While national averages give us a broad overview, insurance is regulated at the state level. The way claims are handled can vary wildly depending on where you live. For a detailed breakdown of these trends, you can review the 2025 Auto Insurance Complaints Report.
The Worst Auto Insurers by State-Level Complaint Ratios
State insurance departments track justified complaints closely. Looking at key states like California, Texas, and Illinois, we find some surprising outliers:
- California: In the 2024 California Consumer Complaint Study – Automobile, State National Insurance Company, Inc. recorded a justified complaint ratio of 55.9 per 100,000 exposures in 2023. This is astronomically higher than the industry average. By comparison, Esurance Property and Casualty sat at 27.6, while GEICO Casualty Company had a ratio of 5.1 (with 13 justified complaints). Meanwhile, State Farm Mutual Automobile Insurance Co. had the highest raw number of justified complaints at 105, but maintained a low ratio of 2.7 due to its massive customer base.
- Texas: Data from the Texas Department of Insurance (TDI) reveals that Progressive County Mutual Insurance Company had the most validated complaints over a multi-year period stretching from 2011 to 2026, totaling 1,564 submitted complaints. However, when looking at the percentage of complaints actually validated by regulators, Tesla Property & Casualty, Inc. took the top spot with an incredible 72.47% validation rate — meaning nearly three out of every four complaints filed against them were found to have merit.
- Illinois: In 2023, American Alliance Casualty Company stood out with 462 auto complaints, resulting in a ratio of 4.2877 complaints per $1 million in earned premium. During the same year, State Farm Mutual Automobile Insurance Company recorded 399 auto complaints, with 285 of those tied directly to claims handling.
If you are trying to balance customer service with your monthly budget, check out our analysis of the Cheapest Auto Full Coverage Insurance to find carriers that offer great rates without sacrificing claims quality.
The Worst Homeowners Insurers by Justified Complaint Ratios
Homeowners insurance complaints have skyrocketed in recent years, driven by rising construction costs, inflation, and severe weather. In California, several carriers have generated high complaint ratios:
- Mid-Century Insurance Company recorded the worst justified complaint ratio in California for 2024, coming in at 51.4 justified complaints per 100,000 exposures (96 total justified complaints).
- Farmers Insurance Exchange saw a dramatic rise in consumer dissatisfaction. Its justified complaints jumped from 18 in 2022 to 177 in 2024, causing its complaint ratio to spike from 4.5 to 40.2 per 100,000 exposures.
- State Farm General Insurance Company had the highest absolute number of justified homeowners complaints in California in 2024, with 254 complaints. Because of its massive exposure pool of over 2.1 million policies, its ratio was a more moderate 11.9.
These figures are documented in the 2025 California Consumer Complaint Study – Homeowners. If you are looking to protect both your house and your vehicle under a single, highly rated carrier, we recommend comparing options using our guide on the Best Homeowners Car Insurance Bundle in 2026 – Save More on Home & Auto.
Common Claims Handling Tactics and Validation Rates

Why do consumers file complaints in the first place? It almost always comes down to the claims process. When you pay your premiums on time month after month, you expect the insurer to be there when you experience a loss. Unfortunately, many policyholders find themselves facing a “deny, delay, defend” strategy designed to protect corporate profit margins.
To see how these issues affect property owners nationally, you can read the 2024 Homeowners Insurance Complaints Report.
Why Claims Handling Triggers the Most Complaints
Claims handling is statistically the leading cause of insurance complaints across all states. In Illinois, for example, claims handling accounted for 55.7% of all consumer complaints in 2023.
Historically, the most common specific grievances involve:
- Claim Delays: Taking weeks or months to acknowledge a claim, assign an adjuster, or issue a payout.
- Unsatisfactory Settlement Offers: Offering a settlement amount that doesn’t cover the real-world cost of repairs or medical bills.
- Claim Denials: Using obscure policy exclusions to avoid paying a valid claim.
Many major auto insurers rely on proprietary claims-evaluation software, such as Colossus, to calculate settlement values. These programs are designed to standardize payouts, but they often undervalue soft-tissue injuries and vehicle repair costs, forcing policyholders to fight for fair compensation.
If you are curious about how direct-to-consumer models affect these claims timelines, read our breakdown on How Does Direct Auto Insurance Work.
What Percentage of Complaints Are Validated by Regulators?
Not every complaint filed with a state insurance commissioner is validated. Regulators must review the policy contract and state laws to determine if the insurer actually did something wrong, or if there was simply a misunderstanding.
Data from the Texas Department of Insurance shows that validation rates vary heavily by the type of complaint:
- Agent Handling: Complaints about agent behavior or administrative errors have a 30.03% validation rate.
- Customer Service: General policyholder service complaints are validated 28.55% of the time.
- Claims Delays: Despite being the most common source of frustration, delays only have a 21.60% validation rate. This is often because insurers are still operating within the broad, legally allowed timelines of their contracts, even if the customer feels the process is taking too long.
- Claim Denials: Actual denials have a surprisingly low validation rate of 9.41%, as insurers are usually careful to anchor their denials in specific policy language, even if that language is incredibly complex.
In Illinois, State Farm Fire & Casualty Company had 891 homeowners complaints in 2023, with 779 of them tied directly to claims handling. This shows that even if a complaint isn’t technically “validated” as a violation of law, the sheer volume of claims-handling friction remains a massive headache for everyday consumers.
How to Protect Yourself Against High-Complaint Insurers

Dealing with an insurance company that has a high complaint ratio can be incredibly stressful, especially when you are already dealing with the aftermath of a car accident or home damage. However, you are not powerless. By taking a methodical, documented approach, you can protect your rights and push for a fair resolution.
Step-by-Step Guide to Handling a Delayed or Denied Claim
If you find yourself facing an uncooperative insurance adjuster, follow this step-by-step process to build a strong case:
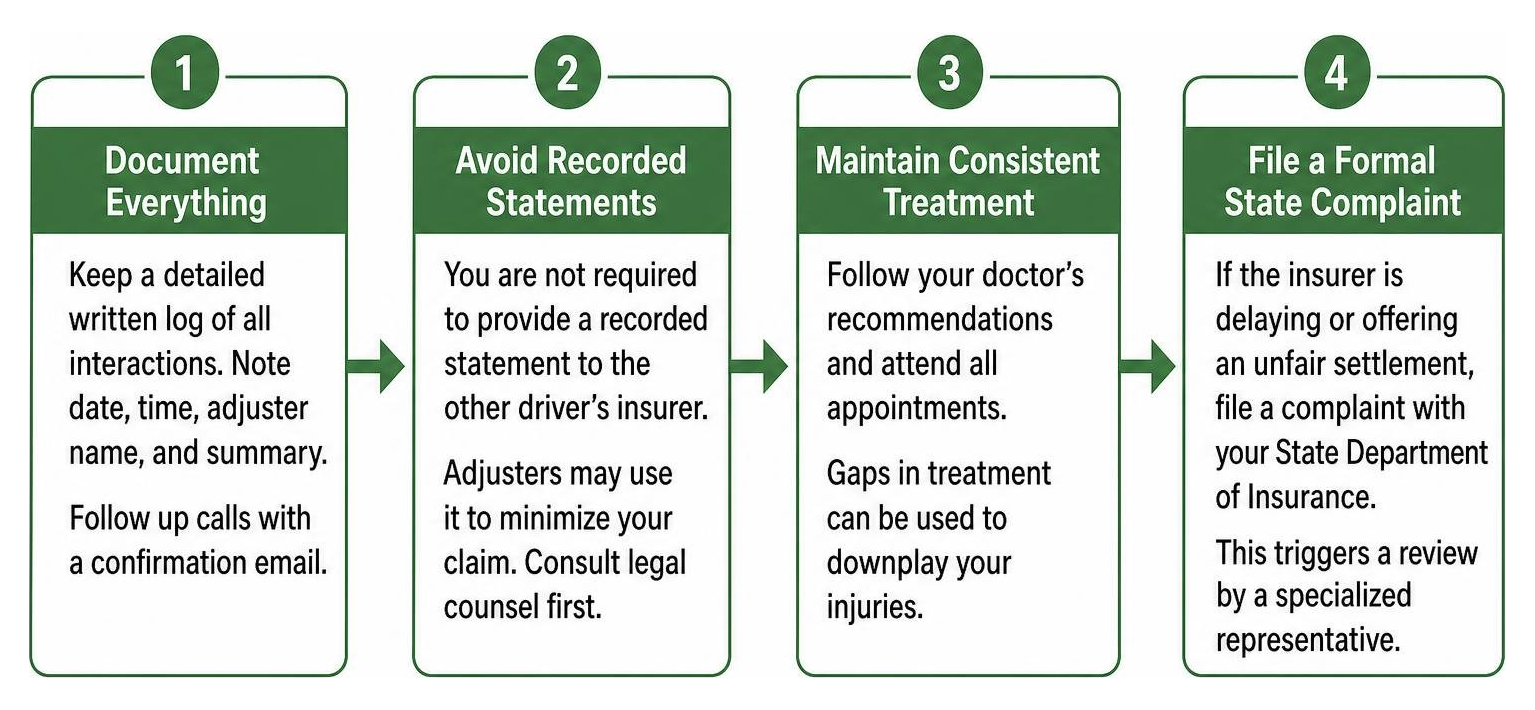
- Document Everything: Keep a detailed, written log of every single interaction with the insurance company. Note the date, time, the name of the adjuster you spoke with, and a summary of what was discussed. Confirm phone conversations by sending a follow-up email summarizing the discussion.
- Avoid Recorded Statements: If you are dealing with an adverse driver’s insurance company, you are not legally obligated to provide a recorded statement. Adjusters often use these statements to find inconsistencies and minimize your claim. Consult with legal counsel before agreeing to be recorded.
- Maintain Consistent Treatment: If you were injured, follow your doctor’s medical recommendations exactly. Gaps in medical treatment are weaponized by insurance software to argue that your injuries are not severe or were pre-existing.
- File a Formal State Complaint: If the insurer is violating state timelines or offering an unfairly low settlement, file an official complaint with your state’s Department of Insurance (e.g., the California Department of Insurance or Texas Department of Insurance). This forces the carrier to assign a specialized representative to review your file.
If you are looking for ways to lower your costs while maintaining high-quality coverage, read our guide on What is the Best Way to Reduce Car Insurance.
Evaluating Insurers: Which Insurance Company Has the Most Complaints to Avoid?
Before you sign a new insurance policy, take fifteen minutes to research the company’s background.
- Check the AM Best Rating: This rating measures the financial strength of the insurer. A company with an “A” rating or higher is financially stable and highly likely to meet its claims obligations.
- Review the Declarations Page: Make sure you understand your policy limits, deductibles, and exclusions before an accident happens.
- Use Comparison Tools: Don’t just look at the cheapest premium. Use reputable comparison sites to look at customer satisfaction scores alongside pricing. You can find the best resources in our guide to the Best Homeowners Insurance Comparison Sites.
Frequently Asked Questions About Insurance Complaints
What is the most common complaint against insurance companies?
The most common complaint against insurance companies is claims handling. This broad category includes unnecessary delays in processing payments, unsatisfactory or “lowball” settlement offers, and outright claim denials. Statistically, claims-handling issues make up over 55% of all consumer complaints filed with state insurance regulators.
How do I check an insurance company’s complaint history?
You can easily check an insurer’s complaint history by visiting the National Association of Insurance Commissioners (NAIC) Consumer Information Source (CIS) online. There, you can enter the company’s name to view its national Complaint Index. Additionally, you should check your state’s Department of Insurance website, which often publishes annual consumer complaint ratio reports specific to local policyholders.
Does a high number of raw complaints mean an insurer is bad?
No, a high number of raw complaints does not automatically mean an insurer is bad. Massive national carriers like State Farm or Progressive write billions of dollars in premiums and cover millions of people, so they naturally receive more complaints in absolute numbers. To get an accurate picture, you must look at the complaint index or ratio, which adjusts the complaint volume relative to the company’s market share and size.
Conclusion
When it comes to protecting your home, your car, and your family, choosing the right insurance provider is one of the most important financial decisions you will make. While a cheap monthly premium is always attractive, the real value of an insurance policy is tested when you have to file a claim.
By looking beyond raw complaint numbers and focusing on normalized complaint indices, you can avoid carriers with a history of bad-faith delays and unfair denials. We encourage you to stay informed, document your claims carefully, and always research an underwriting subsidiary’s regulatory track record before signing on the dotted line.
To stay ahead of the curve on the latest industry data, consumer advocacy tips, and technology updates, Explore our latest AI updates and industry insights to make the smartest decisions for your financial future.