Why the Right Methods of Data Collection Can Make or Break Your Research

The methods of data collection you choose will shape every insight, decision, and outcome your research produces.
Here’s a quick overview of the most common ones:
| Method | Type | Best For |
|---|---|---|
| Surveys & Questionnaires | Primary | Large populations, quick feedback |
| Interviews | Primary | Deep, personal insights |
| Observation | Primary | Real-world behavior tracking |
| Focus Groups | Primary | Group opinions and reactions |
| Experiments | Primary | Testing cause and effect |
| Document Review | Secondary | Existing records and reports |
| Database Analysis | Secondary | Large-scale historical data |
Whether you’re a researcher, a nonprofit, or a small business owner trying to understand your customers — data collection is the foundation of every good decision.
But here’s the problem: most people pick a method out of habit or convenience, not because it fits their question.
That leads to wasted time, unreliable results, and decisions built on shaky ground.
In May 2026, with AI tools making data easier to gather than ever, the challenge isn’t access to data — it’s knowing which method to use, and why.
This guide breaks it all down in plain language, so you can collect better data without needing a research degree.
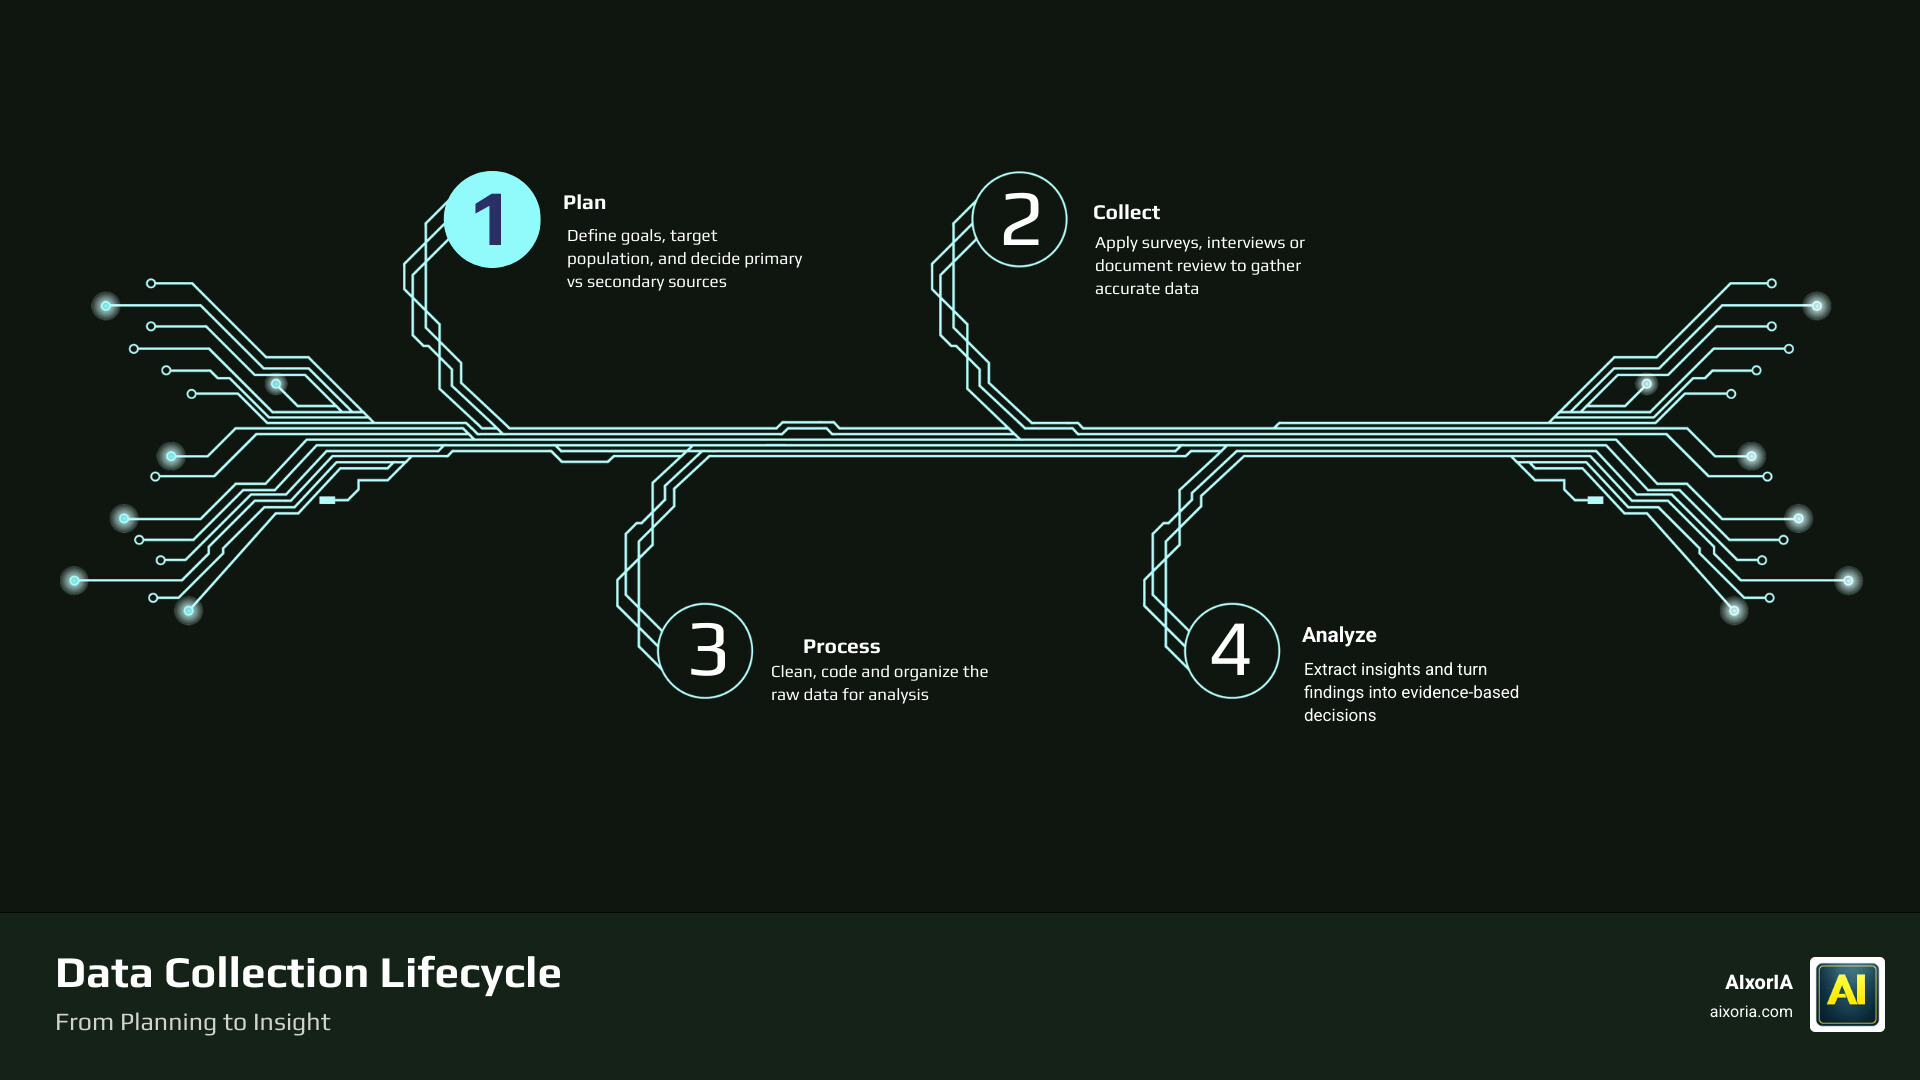
Primary vs. Secondary methods of data collection
When we start any project at AIxorIA, the first thing we ask is: “Does this information already exist, or do we need to go find it ourselves?” This is the fundamental split between primary and secondary methods of data collection.

Primary Data: Straight from the Horse’s Mouth
Primary data is original information gathered specifically for your current research project. Think of it like a custom-tailored suit; it fits your specific needs perfectly because you designed the measurements.
Because primary data is collected first-hand through techniques like surveys or experiments, you have full control over the authenticity and the process. However, it can be time-consuming and expensive. You have to recruit participants, design instruments, and often wait weeks for results.
Secondary Data: Standing on the Shoulders of Giants
Secondary data is information that has already been collected by someone else for a different purpose—think government census data, company annual reports, or academic journals. It is incredibly cost-efficient and saves a massive amount of time.
The downside? You didn’t control how it was collected. You have to be a bit of a detective to ensure the data is still relevant and that the original researchers didn’t have biases that could skew your results. For a deeper look at how these processes work in the modern era, check out Data Collection Methods: Types, Examples and Steps (2026).
To help you decide, we’ve put together this comparison:
| Feature | Primary Data | Secondary Data |
|---|---|---|
| Cost | High (Staff, tools, incentives) | Low (Often free or subscription-based) |
| Time | Long (Weeks to months) | Short (Hours to days) |
| Specificity | High (Tailored to your goal) | Low (General purpose) |
| Control | Full control over variables | No control over original process |
| Authenticity | Verified by the researcher | Depends on the source’s credibility |
In 2026, many businesses use Best AI Tools for Data Integration in 2026 to pull these disparate secondary sources into one clear picture.
Deep Dive into Primary Research Techniques
If you decide that you need fresh, original insights, you’ll be looking at primary methods of data collection. These are the “boots on the ground” techniques that allow us to see what is happening in the real world right now.

One of the greatest strengths of primary research is the ability to use direct observation. Sometimes, people don’t do what they say they do. Observation eliminates the gap between reported behavior and actual behavior. For example, a retail store might track how customers navigate aisles rather than just asking them where they shop.
If you are looking for a “why” instead of just a “what,” experimental control is your best friend. Experiments are the only method that can truly establish causation rather than just correlation. By changing one variable (like the color of a “Buy Now” button) and keeping everything else the same, you can prove exactly what caused a change in behavior. For more on how to structure these, see this Complete Guide for Researchers.
Core Qualitative and Quantitative methods of data collection
Most research falls into two buckets: numbers (quantitative) or stories (qualitative).
- Surveys and Questionnaires: These are the bread and butter of the research world. They are standardized, making them easy to analyze. A survey of 400 people typically gives you a ±5% margin of error at a 95% confidence level. They are great for reaching large, widespread populations at a low cost.
- Interviews: These can be structured, semi-structured, or unstructured. A single one-hour interview can produce 10,000 to 15,000 words of transcript! While time-consuming, they provide a depth of insight that a checkbox survey never could.
- Focus Groups: Usually involving 8-10 participants, focus groups are fantastic for seeing how people react to each other’s ideas. The group interaction often surfaces insights that wouldn’t emerge in a one-on-one setting.
- Participant Observation: This is where the researcher actually joins the environment they are studying. It’s the core of ethnographic research and provides a “fly on the wall” perspective that is incredibly rich.
To manage the massive amount of text and data these methods generate, we often recommend using the Best AI Tools for Business Productivity to help with transcription and initial sentiment analysis.
Choosing the Right methods of data collection for Your Research
Choosing a method shouldn’t be like picking a flavor of ice cream—it needs to be a strategic decision. We recommend following these steps:
- Define Your Objective: Are you trying to describe a trend, explain a cause, or predict the future?
- Check Your Resources: Do you have the budget for a 1,000-person survey? Do you have the time to conduct 20 three-hour interviews?
- Assess Your Sample Size: If you need to speak for an entire country, you’ll need quantitative surveys. If you want to understand the experience of five specific CEOs, interviews are better.
- Consider Population Reach: Is your target audience online? If they aren’t easily approachable, mailed questionnaires or phone calls might be necessary.
Once you have your data, you’ll need to make sense of it. We’ve found that the Best AI Tools for Data Analysis and Visualization in 2026 can turn raw numbers into beautiful, actionable stories in minutes.
Maximizing Outcomes with Mixed-Method Approaches
Why choose just one? The National Science Foundation actually recommends a mixed-method approach. This is often called triangulation.
By combining the “breadth” of quantitative data (like a survey) with the “depth” of qualitative data (like a focus group), you can substantiate your findings and minimize the weaknesses of any single method. For example, if a survey shows that 75% of your employees feel stressed, a follow-up focus group can tell you why—is it the lighting, the workload, or the coffee?
Longitudinal studies are another powerful mixed approach. These track the same participants over a long period. In educational research, for instance, researchers might use surveys to track student attitudes from freshman year all the way through graduate school.
To handle the complex data pipelines that mixed-method research requires, modern teams often look toward the Best ETL Tools in Data Warehouse in 2026 to ensure their qualitative and quantitative data can actually “talk” to each other in a single database.
Ensuring Data Quality and Ethical Standards
Data is only useful if it’s “good” data. We focus on two main pillars: Validity (does the tool measure what it claims to?) and Reliability (would we get the same result if we did it again?).
The Ethics Checklist
In 2026, ethical data collection isn’t just a “nice to have”—it’s a legal requirement. Whether you are following GDPR, CCPA, or other privacy regulations, you must ensure:
- Informed Consent: Participants must know what they are signing up for.
- Confidentiality: Minimize disruption and protect identities.
- Bias Reduction: Use neutral phrasing. Leading questions are the enemy of truth.
- Pilot Testing: Always test your survey on a small group (10-20 people) before sending it to thousands. It’s the best way to catch confusing wording before it ruins your dataset.
Before you start, we always suggest submitting your plan to an Institutional Review Board (IRB) or an ethics committee to ensure your methods of data collection are above board.
Frequently Asked Questions about Data Collection
What is the difference between a questionnaire and a schedule?
While they look similar, the difference is in the administration. A questionnaire is sent to the respondent (via mail or email), and they fill it out themselves. A schedule is filled out by an enumerator or researcher while they are talking to the respondent. Schedules generally have higher response rates and more accurate data because the researcher can clarify questions on the spot.
How many participants are needed for a focus group?
Standard practice is to have 8-10 participants. If the group is too small, you don’t get enough interaction; if it’s too large, it becomes hard to manage and some voices get drowned out. Usually, running 3-5 of these groups is enough to reach “saturation,” where you stop hearing new ideas.
Why is triangulation important in modern research?
Triangulation is important because it acts as a “fact-check” for your research. If your survey says people love your product, but your observations show they struggle to use it, you’ve found a critical gap that a single method would have missed. It provides a more credible, three-dimensional view of the truth.
Conclusion
At AIxorIA, we believe that data is the “new oil,” but it’s only valuable once it’s refined. Choosing the right methods of data collection is the first step in that refinement process. By matching your method to your research question and maintaining high ethical standards, you ensure your strategy is built on facts, not guesswork.
As we move further into 2026, the integration of AI will only make these processes faster. If you’re looking to streamline your data pipelines without learning to code, check out our guide on the Best No-Code ETL Tools in 2026 to help you manage your findings with ease. Happy researching!
1 thought on “Methods of Data Collection in 2026: 7 Types, Examples & Best Practices”