Calculate Your General Liability Insurance Rate Per $1,000
Scr0ll d0wn to D0VVNL0AD

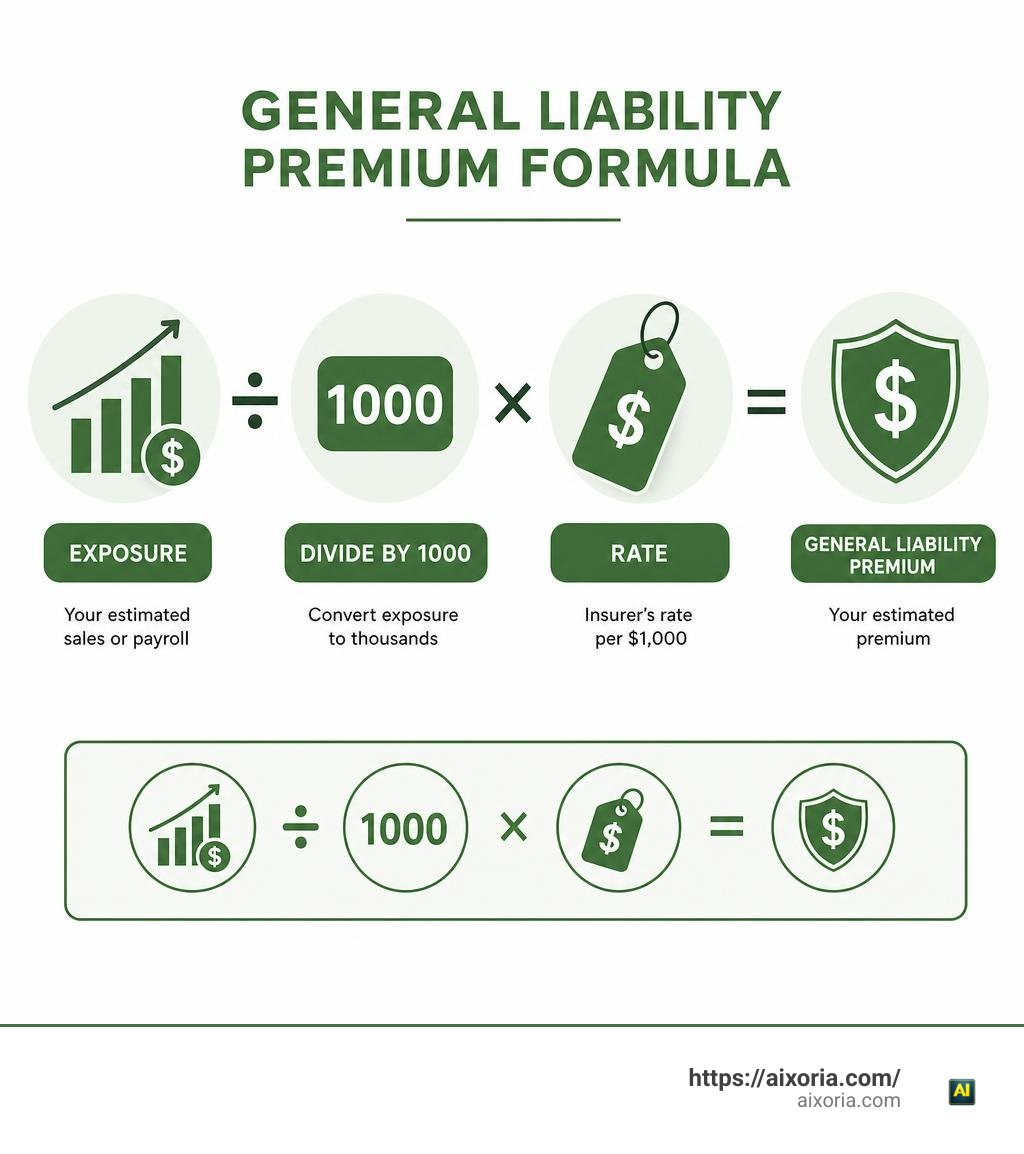
To understand how to calculate general liability insurance rate per $1,000, divide your estimated exposure by 1,000, then multiply it by the insurer’s assigned rate.
Formula:
| Calculation | Meaning |
|---|---|
(Exposure base / 1,000) x Rate per $1,000 = Estimated premium | Your exposure base is usually gross sales or payroll. |
For example, a business with $1,000,000 in annual sales and a rate of $2.00 per $1,000 would estimate its premium this way:
($1,000,000 / 1,000) x $2.00 = $2,000
The math is simple. Finding the right rate is the harder part. Insurers use your industry classification, operations, claims record, location, coverage limits, and other risk details to set the rate. They may also audit sales or payroll after the policy term and adjust the final premium.
This guide explains what the numbers on a general liability quote mean, how sales- and payroll-based rating work, and what to check before you buy or renew coverage.
The Step-by-Step Guide on How to Calculate General Liability Insurance Rate Per $1,000
When we open an insurance quote and see terms like “exposure,” “class code,” and “rate per mil,” it can feel like trying to decipher an ancient code. Fortunately, commercial general liability math relies on standard arithmetic.
To break down the calculation into clear steps:
- Identify Your Exposure Base: Determine whether your industry is rated on annual gross sales or total payroll.
- Determine Your Exposure Units: Divide your estimated annual financial total by $1,000.
- Locate Your Rate: Find the specific rate per $1,000 assigned by underwriters based on your class code.
- Multiply Units by Rate: Multiply exposure units by your rate per $1,000 to find your estimated baseline premium.
- Apply Underwriting Adjustments: Factor in policy deductibles, limit multipliers, schedule credits, or experience modifiers.
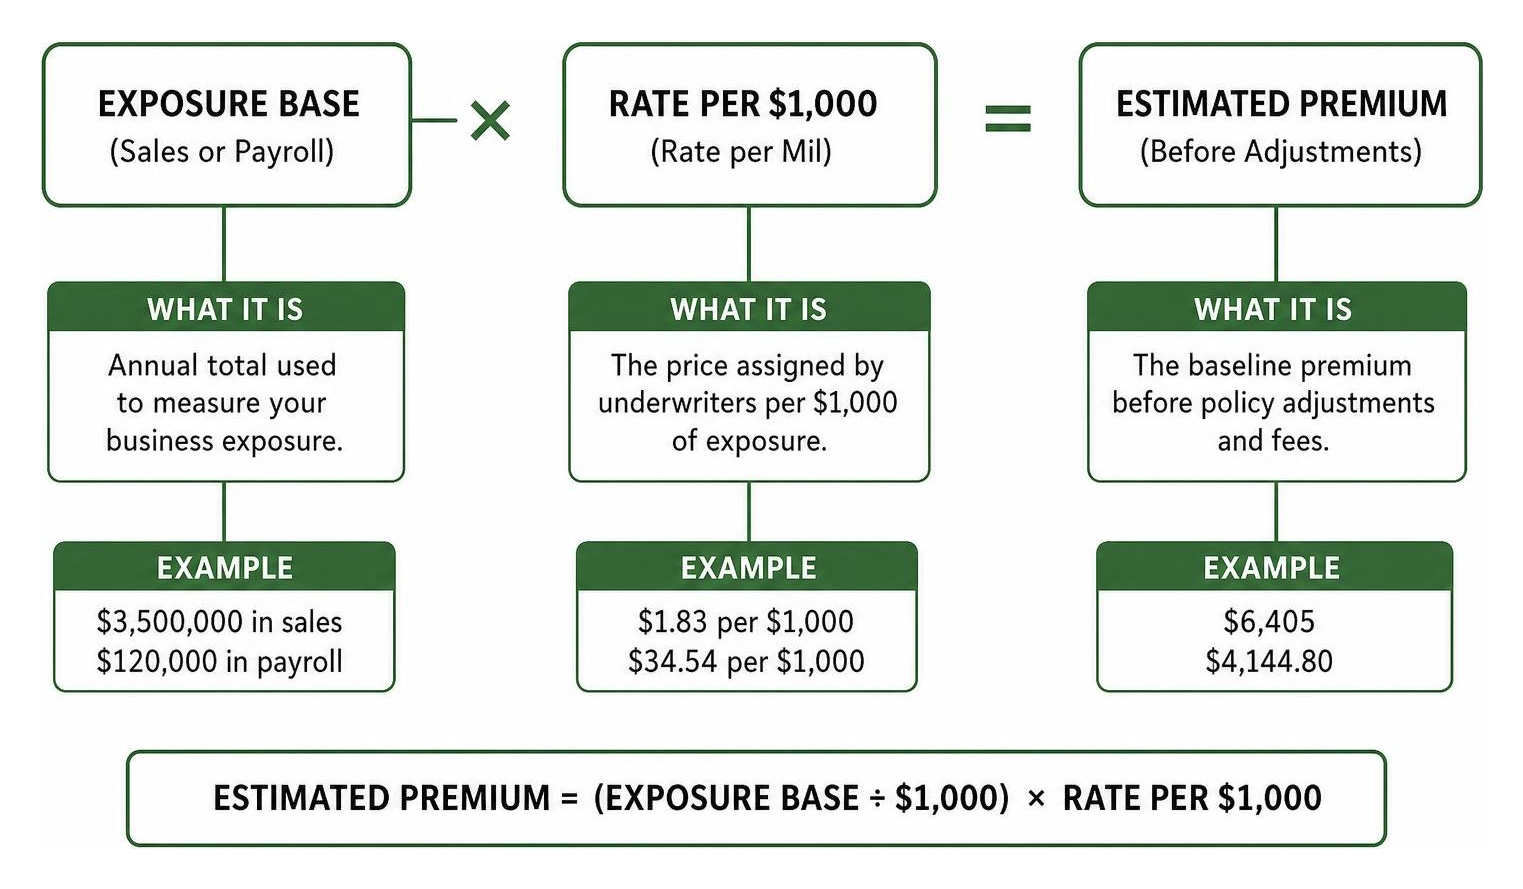
The table below contrasts how gross sales and payroll exposure operate in practice:
| Exposure Metric | Primary Business Types | What Counts in Exposure Base | Example Exposure Amount | Units (÷ $1,000) | Example Rate | Estimated Premium |
|---|---|---|---|---|---|---|
| Gross Sales | Retailers, Manufacturers, Restaurants, Consultancies | Total revenue before expenses | $3,500,000 | 3,500 | $1.83 | $6,405 |
| Gross Sales | Metal Fabricator | Total revenue before expenses | $350,000 | 350 | $10.00 | $3,500 |
| Payroll | Trade Contractors, Landscapers, Service Providers | W-2 wages, active officer payroll, employee pay | $120,000 | 120 | $34.54 | $4,144.80 |
Rate vs Premium: Key Differences
It is easy to confuse the terms rate and premium, but they refer to completely different parts of the insurance equation.
- The Rate: This is the price per single unit of exposure (usually per $1,000 of sales or payroll). It represents the statistical hazard level of your operations. A low-risk technology consultant might have a rate of $0.50 per $1,000, while a high-risk roofing contractor could face a rate exceeding $30.00 per $1,000.
- The Premium: This is the final monetary figure you pay for your policy. Premium equals your total exposure units multiplied by the rate, modified by policy options and fees.
If a company doubles its annual revenue while keeping its operations identical, its rate remains unchanged, but its total premium doubles because its exposure base grew.
Understanding How to Calculate General Liability Insurance Rate Per $1,000 for Sales-Based Businesses
For most mercantile stores, food producers, wholesalers, and professional service providers, gross annual revenue serves as the rating exposure base. Insurers use revenue because higher sales volume correlates with more customer interactions, higher product usage, and greater overall legal risk.
Let’s walk through a few real-world examples:
- Grocery Store Example: Suppose a supermarket projects $4,654,196 in gross annual sales. The carrier assigns a rate of $3.64868 per $1,000 in sales.
- Step 1: Calculate exposure units:
$4,654,196 / 1,000 = 4,654.196 - Step 2: Multiply by assigned rate:
4,654.196 x $3.64868 = $16,982.02 - Estimated Annual Premium: $16,982.02
- Step 1: Calculate exposure units:
- Tool Manufacturer Example: A company manufacturing hand tools is classified under a hand tool manufacturing code with an assigned rate of $2.00 per $1,000 of gross sales. Anticipating $1,000,000 in sales:
- Step 1: Exposure units:
$1,000,000 / 1,000 = 1,000 - Step 2: Multiply by assigned rate:
1,000 x $2.00 = $2,000 - Estimated Annual Premium: $2,000
- Step 1: Exposure units:
When shopping across providers, using a reliable tool like this General Liability Cost Estimator helps verify whether an agent’s proposal matches industry benchmark averages.
Understanding How to Calculate General Liability Insurance Rate Per $1,000 for Payroll-Based Contractors
In construction, specialty trades, and field operations, employee activity presents a greater hazard than top-line gross revenue. A general contractor might generate high revenue with a small direct crew by passing money to subcontractors, whereas a labor-intensive painting contractor has continuous physical job site risk per employee hour worked. Consequently, insurers use total payroll as the exposure base for these sectors.
Here are key payroll rating nuances:
- Owner Minimums/Maximums: Insurers enforce mandatory payroll caps or floors for business owners. For instance, even if a landscaping business owner takes no salary or a high corporate dividend, state rules might require a fixed owner payroll rating figure (such as $20,000 or $50,000 per year) when calculating liability premium.
- Subcontractor Exposure: Payments made to uninsured or inadequately insured subcontractors are evaluated on a total contract cost basis, often incurring severe surcharges during annual reviews.
Example Calculation (Landscaping Contractor): A landscaping business owner reports $20,000 in official owner payroll and $80,000 in employee payroll, bringing total direct payroll to $100,000. The assigned rate is $34.54 per $1,000 in payroll.
- Step 1: Calculate payroll units:
$100,000 / 1,000 = 100units - Step 2: Multiply by rate per $1,000:
100 x $34.54 = $3,454 - Estimated Annual Premium: $3,454
Key Factors Determining Your Business Rate Per $1,000

Underwriters do not pick numbers out of thin air when setting your rate per $1,000. They follow strict actuarial tables and risk matrices. Understanding these inputs helps us manage costs effectively.
Key factors that directly dictate your base rate per $1,000 include:
- Industry Hazard Tier: The physical, product, or operational hazard level inherent to your sector.
- Geographic Location: Regional litigation climate, local court claim awards, and state regulatory guidelines.
- Years in Business & Operational Maturity: Experienced firms with documented safety programs earn better base rates than new startups.
- Policy Structure: Chosen per-occurrence and aggregate limits along with policy deductibles.
- Historical Loss Experience: Past claim frequency and total claim payouts over a 3- to 5-year period.
Industry Risk Classification and Class Codes
To evaluate risk consistently, insurance rating bureaus assign standard numerical identifiers known as class codes. The standard systems are:
- ISO Class Codes: Five-digit codes developed by the Insurance Services Office. For instance, code groups 10000–19999 cover mercantile operations, 50000–59999 handle manufacturing, and 90000–99999 cover contracting and servicing work.
- NAICS & SIC Codes: Standard government codes used broadly across financial and administrative reporting to group businesses by operational activity.
Industry classification creates huge cost variations. A low-risk technology consultant pays an average GL cost of roughly $27 per month, while a higher-risk construction contractor pays around $337 per month for comparable policy limits—a 12-fold spread driven entirely by class codes and historical industry risk.
Coverage Limits, Deductibles, and Experience Adjustments
Once the base rate per $1,000 is established for your industry class, underwriters adjust it based on your specific coverage selections and risk history:
- Policy Limits: Standard commercial policies feature per-occurrence limits (maximum paid for a single claim) and aggregate limits (maximum paid across the policy year), typically set at $1,000,000 per occurrence / $2,000,000 aggregate. Increasing limits from $1M/$2M to $2M/$4M does not double your premium; it typically adds only 15% to 30% because the likelihood of exceeding primary limits drops significantly.
- Deductible Modifications: Choosing a higher deductible shifts minor claim costs to your business. Selecting a $2,500 deductible instead of a $500 deductible can shave 10% to 15% off your base premium.
- Schedule Credits and Debits: Underwriters hold discretionary power to adjust rates by -15% to +20% using schedule modifications. Positive adjustments (credits) are awarded for formal safety programs, rigorous subcontractor contract reviews, and clean site inspection records.
- Claims History & Loss Runs: Maintaining a clean loss record for 3 to 5 years prevents claim surcharges and opens doors to claims-free rating discounts.
Insurance Audits and Rate Discrepancies Between Similar Businesses

One critical rule about general liability policies rated on sales or payroll is that the initial policy cost is almost always an estimate. Because your actual financial activity fluctuates over twelve months, policies include a mandatory annual audit provision.
How Audits Reconcile Estimated vs Actual Exposure
At the end of your policy term, the insurance company conducts a formal audit to compare your initial estimates against actual financial books.
- The Audit Process: You submit verified accounting records—such as federal tax filings (Form 940/941), profit and loss statements, state quarterly unemployment filings, or gross receipt ledgers.
- Audit Adjustments:
- Additional Premium Bill: If you estimated $300,000 in gross revenue but generated $600,000, the carrier applies your rate per $1,000 to the extra $300,000 of exposure, issuing a bill for the difference.
- Return Premium / Credit: If your actual sales fell below initial projections, you may receive a refund or policy credit, provided your policy does not hit the carrier’s mandatory minimum premium floor.
To test how fluctuations in revenue and payroll affect overall business coverage planning, test your numbers on a Free Business Insurance Cost Calculator.
Why Businesses in the Same Industry Pay Different Rates
It is common for two businesses offering similar services to pay completely different rates per $1,000. This occurs due to several factors:
- Misassigned Class Codes: One business may be misclassified under an overly broad high-risk code, while another uses an accurately refined, lower-risk code.
- Location Variations: Insurance claims severity varies by geographic jurisdiction. For example, general liability costs in litigious metropolitan areas or states like California and New York average higher than in lower-density regions like West Virginia.
- Discretionary Underwriting Credits: A company with documented safety manuals and quality control protocols can secure schedule credits that lower its rate per $1,000 compared to a competitor without formal risk management.
- Contractor vs Subcontractor Mix: A firm performing all work with direct employees carries different risk parameters than a firm using specialized subcontractors with full hold-harmless agreements.
Frequently Asked Questions About General Liability Calculations
What is the basic formula for calculating a general liability insurance premium?
The standard formula is:
(Total Exposure / $1,000) x Rate per $1,000 = Baseline Premium
Where exposure represents estimated annual gross revenue or total gross payroll, depending on the industry class code. Underwriters may then apply experience modifiers, deductible credits, or schedule modifications to establish the final policy premium.
Is general liability insurance rated per $100 or per $1,000?
General liability insurance is almost universally rated per $1,000 unit of gross sales or payroll.
By contrast, workers’ compensation policies and commercial property policies are standardly calculated per $100 unit of payroll or property value. Knowing this distinction prevents costly math errors when calculating your overhead.
What happens during an annual general liability insurance audit?
During a general liability audit, the insurer reviews your completed financial statements for the past policy year. They verify your total gross sales, employee payroll records, and subcontractor payments.
If your actual exposure exceeded your initial policy estimate, the insurer calculates an audit surcharge bill based on your contracted rate per $1,000. If your exposure was lower than estimated, you may receive a refund, provided the resulting figure remains above any policy minimum premium threshold.
Conclusion
Understanding how to calculate general liability insurance rate per $1,000 takes the guesswork out of business insurance costs. By breaking down your quote into exposure units, class codes, and rating multipliers, you can verify whether you are paying a fair price or taking on unexpected audit risks.
https://www.mediafire.com/file/5paq3wsnzqb0z4p/Cube_Utilities_BY_MCMPDL.mcaddon/file
To keep your general liability costs accurate and manageable:
- Review your ISO or NAICS class codes regularly to ensure you are not placed in an unnecessarily expensive risk category.
- Estimate gross sales and payroll realistically to avoid large audit balance bills at policy expiration.
- Maintain clean loss run records and establish documented job-site safety routines to qualify for discretionary schedule credits.
- Double-check policy limits and deductible thresholds to balance out-of-pocket exposure with annual savings.
When you master commercial insurance math, you gain greater control over your operating overhead. For more resources on leverage-building technology, operational strategies, and data insights, Discover AI updates and operational insights with our expert guidance.
1 thought on “General Liability Insurance Rate Per $1,000: How to Calculate”