What Are the Top 10 Insurance Companies in the U.S.?
Scr0ll d0wn to D0VVNL0AD

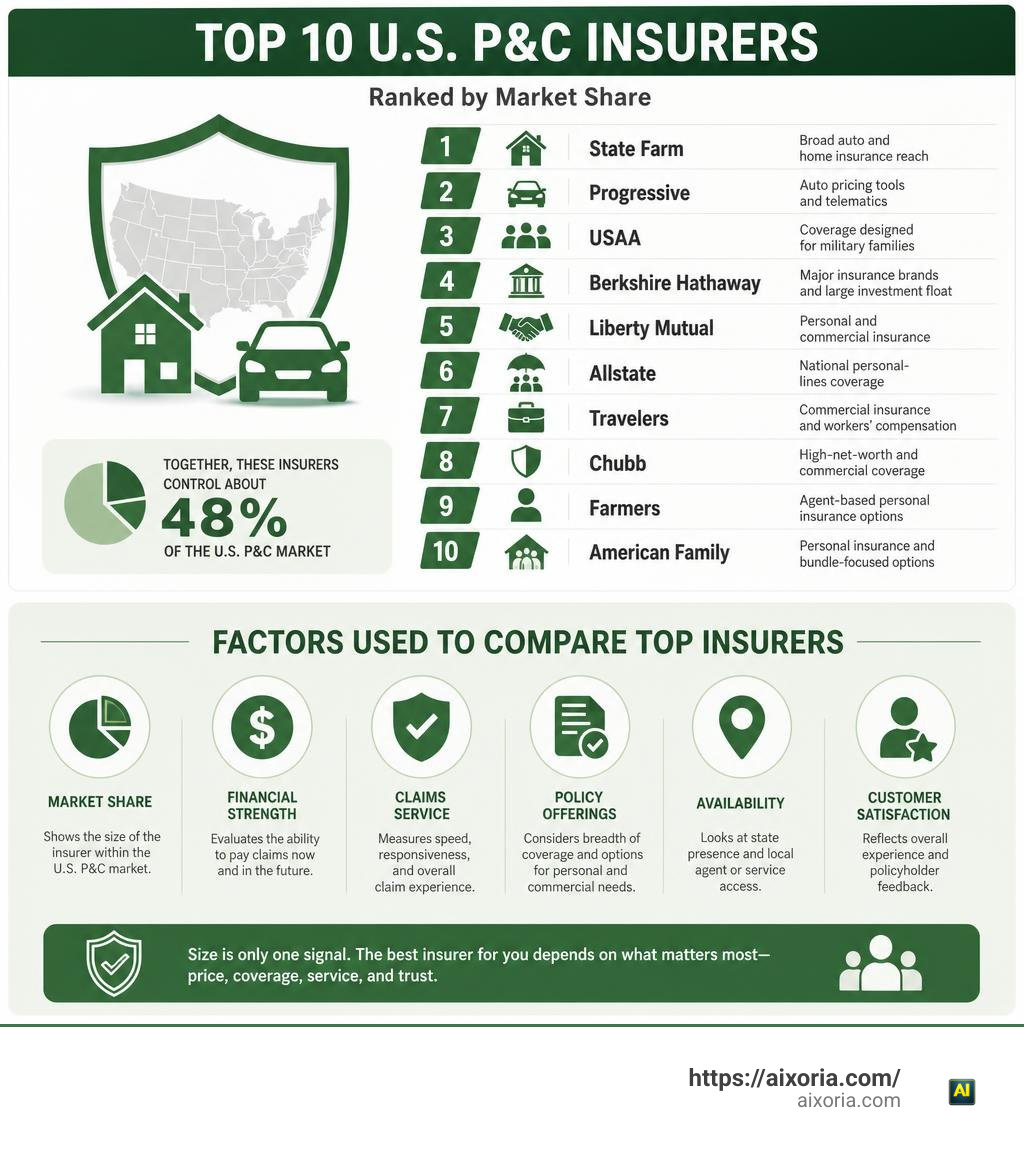
What are the top 10 insurance companies? For U.S. property and casualty insurance, the leading groups by market share are State Farm, Progressive, USAA, Berkshire Hathaway, Liberty Mutual, Allstate, Travelers, Chubb, Farmers, and American Family.
Together, these insurers control about 48% of the U.S. P&C market. But “top” does not always mean best for you. A company may lead in auto insurance, high-value homes, commercial coverage, life insurance, or health plans for very different reasons.
| Rank | Leading U.S. P&C insurance group | Known for |
|---|---|---|
| 1 | State Farm | Broad auto and home insurance reach |
| 2 | Progressive | Auto pricing tools and telematics |
| 3 | USAA | Coverage designed for military families |
| 4 | Berkshire Hathaway | Major insurance brands and large investment float |
| 5 | Liberty Mutual | Personal and commercial insurance |
| 6 | Allstate | National personal-lines coverage |
| 7 | Travelers | Commercial insurance and workers’ compensation |
| 8 | Chubb | High-net-worth and commercial coverage |
| 9 | Farmers | Agent-based personal insurance options |
| 10 | American Family | Personal insurance and bundle-focused options |
Comparing leading insurers is a smart strategy because size is only one signal. Price, policy wording, financial strength, local availability, and claims service can matter far more than a national ranking.
Key Criteria for Evaluating Leading Insurers
When we evaluate the marketplace to see who truly sits at the top, we quickly learn that size alone does not tell the whole story. An insurance company can be massive in terms of total assets on its balance sheet, but that does not guarantee it will offer the best customer service or the lowest auto rate on your block. To gain a complete picture, industry analysts and smart consumers evaluate carriers across several core metrics. For additional industry context, the Insurance Information Institute publishes useful facts and statistics on insurance company rankings.
First, we look at market share and net premiums written. Net written premiums represent the total dollars a company collects from policyholders after deducting premiums passed along to reinsurers. In property and casualty (P&C) lines, the top 10 largest P&C insurers control roughly 48% of the entire U.S. market, while the top 25 carriers account for approximately two-thirds. This concentration shows that while thousands of insurance entities exist, a handful of industry powerhouses hold the vast majority of policyholder trust and capital.
Second, we evaluate revenue scale and total assets. For publicly traded giants, revenue includes earned premiums, health benefit service charges, investment yields, and administrative fees. Asset size measures the sheer weight of an insurer’s balance sheet, including its general account, which backs future claim payouts.
Third, we examine underwriting profitability and financial stability using indicators like the combined ratio, policyholder surplus, and investable float:
- Combined Ratio: This measures underwriting efficiency by adding loss ratios and expense ratios. A combined ratio below 100% means the carrier is making a profit strictly on its insurance policies before factoring in investment returns.
- Policyholder Surplus: This serves as the insurer’s financial cushion, the capital cushion left after subtracting all liabilities from total assets. A growing surplus indicates strong solvency protection against unexpected catastrophic losses.
- Investable Float: Pioneered to perfection by investment conglomerates, float is the pool of money collected upfront in premiums that has not yet been paid out in claims. Carriers invest this capital to generate substantial investment income.
Finally, qualitative factors such as customer satisfaction, policy wording clarity, and claims processing speed provide the ultimate test of value. Official industry statistics demonstrate how carrier rankings can shift dramatically depending on whether you sort by market share, private auto lines, commercial coverage, or life and annuity volume.
What Are the Top 10 Insurance Companies in the U.S. by Market Share?
Understanding what are the top 10 insurance companies requires looking directly at property and casualty market distribution across the United States. P&C insurers write policies covering physical assets—such as cars, homes, and business structures—as well as legal liability exposures arising from accidents or injuries.
The U.S. P&C market generates well over $938 billion in net written premiums annually. Within this massive sector, market share is heavily concentrated among household names. The table below outlines the top 10 property and casualty insurance groups in the country, sorted by market share and net written premium scale based on recent industry financial reports.
| Rank | Insurance Group / Carrier | Market Share (%) | Key Focus / Primary Market Segment | Financial Rating Benchmark |
|---|---|---|---|---|
| 1 | State Farm Group | 12.89% | Personal Lines (Auto & Homeowners) | A++ (AM Best) |
| 2 | Progressive Insurance Group | 8.85% | Auto Insurance & Telematics Innovation | A+ (AM Best) |
| 3 | USAA Group | 4.49% | Military Personnel & Family Members | A++ (AM Best) |
| 4 | Berkshire Hathaway Group | 4.37% | Multi-line, Direct Auto (GEICO), Reinsurance | A++ (AM Best) |
| 5 | Liberty Mutual Group | 4.30% | Personal Lines & Global Commercial Lines | A (AM Best) |
| 6 | Allstate Insurance Group | 3.92% | Personal Auto, Home, & Captive Agent Network | A+ (AM Best) |
| 7 | Travelers Group | 3.88% | Commercial Lines, Workers’ Comp, Auto/Home | A++ (AM Best) |
| 8 | Chubb Ltd Group | 3.58% | High-Net-Worth Personal Lines & Commercial | A++ (AM Best) / AA (S&P) |
| 9 | Farmers Insurance Group | 2.96% | Agent-Driven Personal & Small Business | A (AM Best) |
| 10 | American Family Insurance Group | 2.12% | Regional & National Personal/Commercial Bundles | A (AM Best) |
As detailed in comprehensive market reports, these ten carriers command almost half of the entire U.S. property and casualty marketplace.
Core Features of What Are the Top 10 Insurance Companies
To understand why these ten giants dominate, we must look beyond their logos and examine what makes each business model unique:
- State Farm: Operating as a mutual insurance company, State Farm leads the entire P&C industry with $107.76 billion in net premiums written in a single year. Its auto insurance line alone accounts for roughly 65% of its total P&C written premiums. Through its vast network of exclusive local agents, State Farm maintains unmatched brand presence in personal auto and homeowners lines.
- Progressive: Known for digital agility and underwriting analytics, Progressive recorded spectacular growth, pushing its net written premiums past $74 billion—a year-over-year increase exceeding 20%. Progressive pioneered telematics programs (like Snapshot) that price policy premiums based on real-time driver telemetry.
- USAA: Operating as a reciprocal insurance exchange, USAA caters exclusively to active-duty military, veterans, and eligible family members. Capturing a 4.49% market share, USAA consistently earns high scores for customer satisfaction, claims handling, and policyholder retention.
- Berkshire Hathaway: Holding a 4.37% market share, Berkshire Hathaway operates prominent direct-to-consumer auto insurers alongside major commercial and reinsurance divisions. Its insurance operations generate more than $170 billion in investable float, which supports long-term corporate equity investments and acquisitions.
- Liberty Mutual: A global powerhouse with a 4.30% domestic market share, Liberty Mutual provides customized personal auto, homeowners, and commercial liability coverages distributed through independent agents, digital platforms, and direct marketing.
- Allstate: Controlling a 3.92% market share, Allstate maintains strong market reach across individual driver protection, homeowners policies, and roadside protection through both direct-to-consumer and exclusive local agency networks.
- Travelers: With approximately $46.4 billion in total annual revenue, Travelers holds the distinction of being the only property-casualty insurer included in the Dow Jones Industrial Average. It is a dominant force in commercial lines insurance and workers’ compensation coverage.
- Chubb: As the premier international insurer for high-net-worth individuals and major commercial enterprises, Chubb operates across 54 countries. Holding top financial ratings of AA from S&P and A++ from AM Best, Chubb specializes in customized coverage for luxury homes, high-value assets, and complex corporate exposures.
- Farmers: Delivering coverage through localized agency connections, Farmers controls nearly 3% of the U.S. P&C market, offering personal auto, property, and business protection options.
- American Family: With a 2.12% market share, American Family offers competitive bundle savings—often providing up to 40% in discounts when policyholders combine auto, home, and umbrella coverages.
Tracking shifting market positions across industry reports helps us spot which carriers are expanding rapidly and which are tightening their risk parameters.
Sector Breakdown: How What Are the Top 10 Insurance Companies Perform Across Business Lines
Market leadership varies across specific insurance categories. An insurer that dominates personal auto might have minimal presence in commercial liability or health insurance.
In private passenger auto insurance, State Farm leads with over 18% market share, closely followed by Progressive and GEICO. In fact, the top four auto carriers control over 56% of the entire U.S. private passenger auto market, driven by high demand for state-mandated coverage.
In homeowners peril insurance, State Farm again takes top honors, writing billions in direct premiums, followed by Allstate, USAA, and Liberty Mutual. However, high-net-worth property risks are overwhelmingly served by specialists like Chubb.
In commercial liability and workers’ compensation, Travelers and Chubb take center stage. Chubb leads commercial lines writing, while Travelers leads the workers’ compensation category with roughly 6.7% market share, protecting businesses against workplace injury costs.
In life and annuities, non-P&C specialists hold the lead. MetLife Inc. leads U.S. life and annuity writers with over $91 billion in direct written premiums (a 9.4% market share), alongside life insurance powerhouses like Prudential Financial, Lincoln Financial, and Massachusetts Mutual.
In managed health care, publicly traded healthcare organizations operate on a whole different level of top-line revenue due to massive health-benefit flows.
Global Giants vs. U.S. Market Leaders: Revenue and Asset Perspectives

When we step back from U.S. property and casualty metrics and review the global financial landscape, the definition of a “top” insurance company expands dramatically. Rankings sorted purely by total revenue or balance-sheet assets reveal massive global institutions operating across life insurance, managed health plans, and sovereign investments.
The world’s largest publicly traded insurance groups generate staggering total revenues. The top 10 global insurance entities combined produce over $1.91 trillion in annual revenue. However, the business models driving these figures differ significantly:
- U.S. Health & Managed Care Organizations: Driven by healthcare administrative scale, groups like UnitedHealth Group lead global public revenue rankings. UnitedHealth Group generated $447.56 billion in revenue, followed by health services leaders like The Cigna Group ($274.58 billion), Elevance Health ($199.12 billion), and Centene ($194.77 billion).
- European Multiline Insurers: European financial titans dominate global asset allocations. Allianz SE of Germany commands total assets exceeding $1.08 trillion and revenues of $159.29 billion. AXA of France controls over $711 billion in total assets with $134.15 billion in annual revenue.
- Asian Life & Savings Leaders: Asia-Pacific insurers manage massive life policy portfolios. China Life Insurance and Ping An Insurance Group hold $957.8 billion and $848.1 billion in non-banking balance sheet assets respectively, with Ping An generating $134.22 billion in revenue. In India, state-backed giants like the Life Insurance Corporation of India (LIC) generate over $104.83 billion in revenue.
Evaluating carriers by assets versus revenue requires distinct analytical frameworks. Balance-sheet assets reflect an insurer’s general account strength and solvency reserves backing long-term policy liabilities. In contrast, total revenue reflects immediate operational cash flow, including health service disbursements and investment yields.
Accounting standard differences also influence global reporting. For instance, international carriers reporting under IFRS 17 handle revenue recognition differently than U.S. entities operating under U.S. GAAP or statutory accounting rules.
Databases and financial asset analyses highlight how global balance sheets act as major capital providers across private credit, infrastructure funding, and global equity markets.
Strategic Framework for Selecting the Right Insurance Provider

Now that we have answered what are the top 10 insurance companies from both market share and global scale perspectives, how do you actually choose among them? Selecting the ideal insurance provider requires aligning your personal risk profile with carrier capabilities.
We recommend using a structured, step-by-step decision framework:
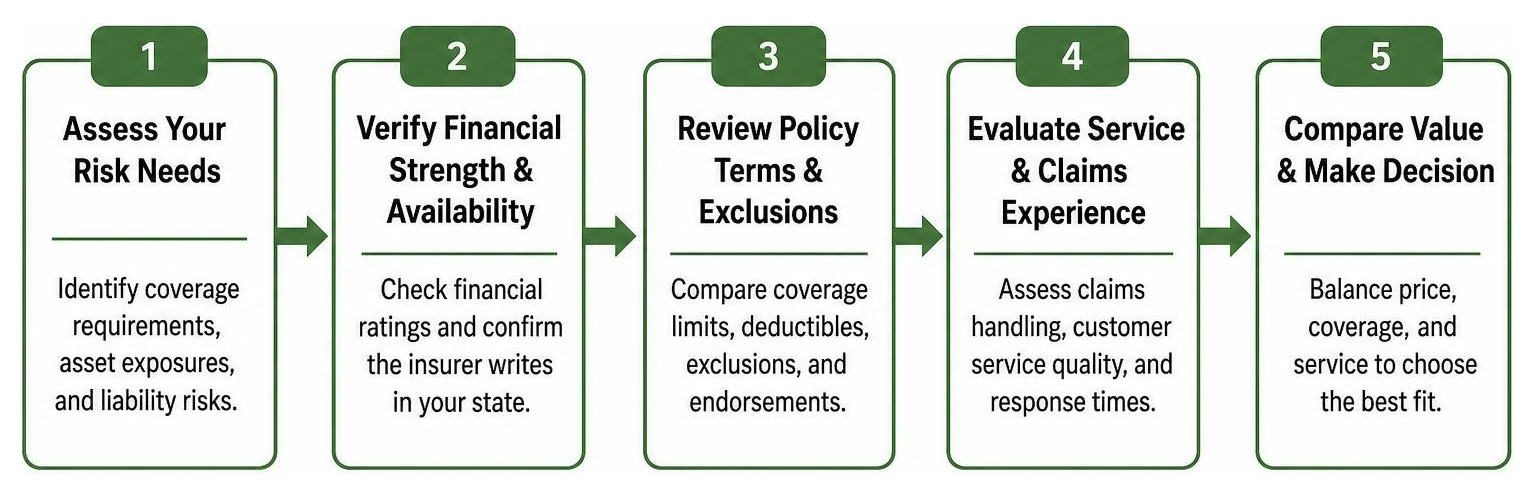
Here is how to navigate each phase of the strategic selection process:
- Conduct a Thorough Risk Assessment: Identify your primary coverage requirements. Are you insuring a standard commuter auto and single-family home, or do you need specialized endorsements for luxury construction, commercial fleets, professional liability, or high-limit umbrella coverage?
- Filter by Financial Ratings & Regional Availability: Before comparing premiums, verify that candidates hold top financial strength ratings from rating agencies like AM Best (aiming for A- or higher) and Standard & Poor’s. Check that the insurer actively writes policies in your specific state and local zip code.
- Examine Policy Wordings and Exclusions: Never choose a policy based on the premium quote alone. Read the fine print to compare actual coverage definitions, sub-limits, deductibles, and policy exclusions. A cheaper policy that excludes primary peril coverage offers little real value.
- Compare Telematics and Modern Discount Options: Check if the carrier offers value-adding technology. Carriers like Progressive offer savings through telematics monitoring, while regional and national personal line insurers offer bundling discounts up to 40% when combining auto and homeowners policies.
- Evaluate Claims Performance & Customer Feedback: Research consumer complaint ratios and claims processing reviews. A top carrier should demonstrate a strong history of prompt claims payouts and fair settlement practices.
Analyzing industry data helps ensure that your chosen carrier possesses the financial backing and capital reserves to fulfill its claims promises when disaster strikes.
Frequently Asked Questions About Top Insurance Carriers
How do asset size and revenue differ when ranking insurance companies?
Asset size measures total non-banking financial holdings owned by an insurer, including cash, bonds, equities, real estate, and mortgage loans held in its general account to back future policy liabilities. Revenue measures overall operational income received over a specific financial period (usually twelve months), incorporating earned policy premiums, investment income, health benefit service charges, and fee-based revenue. Asset heavy companies are typically life insurance and annuity providers, whereas high-revenue groups are frequently health managed care organizations.
Why does private passenger auto insurance dominate P&C market share?
Private passenger auto insurance accounts for the largest individual share of U.S. property and casualty premiums (exceeding $260 billion annually) because vehicle insurance is legally mandatory for drivers in nearly every state. With over 230 million licensed drivers across the nation, high policy volume creates massive premium inflows, allowing top auto writers like State Farm, Progressive, and GEICO to build leading national market shares.
What financial indicators best indicate an insurer’s solvency and safety?
The most critical indicators of an insurer’s solvency and safety include:
- Policyholder Surplus: The statutory financial capital reserve left after subtracting all liabilities from total assets.
- Combined Ratio: An underwriting metric where scores below 100% indicate profitable policy underwriting.
- AM Best Financial Strength Rating: Independent credit ratings ranging from A++ (Superior) down to lower grades, assessing carrier capital adequacy and long-term solvency.
- Loss Reserves: Funds set aside specifically to pay out both known and anticipated future insurance claims.https://www.mediafire.com/file/o8cop2sfuy37is2/Pyramid_City_BY_MCMPDL.mctemplate/file“;
Conclusion
Understanding what are the top 10 insurance companies gives us a powerful vantage point when protecting our families, homes, vehicles, and businesses. Market share leaders like State Farm, Progressive, USAA, and Berkshire Hathaway bring tremendous stability, extensive agent networks, and cutting-edge tech innovations to the table. Meanwhile, specialized global giants like Chubb and Travelers offer focused coverage for commercial operations and high-net-worth assets.
Comparing insurance providers based on policy wordings, financial rating benchmarks, claims service quality, and customized discount structures is always the best strategy for getting optimal value. Stay ahead of evolving industry trends, smart digital tools, and emerging market innovations by exploring the latest resource guides at Discover cutting-edge technology trends and AI updates.