In 2026, business intelligence tools are no longer just dashboard builders. They are decision acceleration engines.
The conversation has shifted from:
“Can we visualize our data?”
to
“How fast can we turn raw data into accurate, revenue-impacting decisions?”
Modern BI platforms now combine predictive analytics, real-time data fabric, AI copilots, and natural language querying. But with dozens of tools claiming “AI-powered insights,” how do you evaluate what actually delivers measurable business value?
This guide goes deeper than feature lists. It introduces a mathematical ROI framework, explains the new Agentic BI era, maps real-world data infrastructure, and compares leading tools with practical, experience-driven observations.
What Are Business Intelligence Tools (In 2026 Terms)?
Traditionally, BI tools collected data from different systems and converted them into dashboards.
In 2026, a business intelligence tool typically includes:
- Real-time data ingestion pipelines
- Cloud-native storage or fabric integration
- AI-driven anomaly detection
- Predictive modeling
- Natural language query interfaces
- Embedded analytics APIs
They don’t just show what happened.
They answer:
- Why did it happen?
- What will happen next?
- What action should we take?
That shift is what separates legacy reporting from modern intelligence systems.
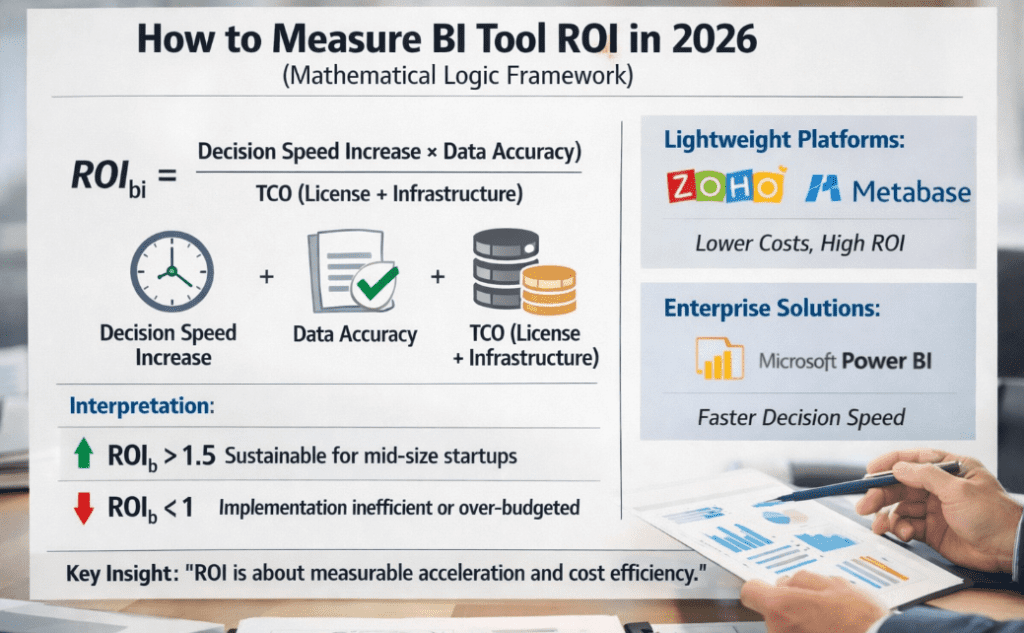
How to Measure BI Tool ROI in 2026 (Mathematical Logic Framework)
Enterprise buyers increasingly evaluate BI systems using measurable logic instead of marketing claims.
A practical evaluation formula many teams now use is:ROIbi=TCO (License + Infrastructure)(Decision Speed Increase×Data Accuracy)
Variable Breakdown
- Decision Speed Increase = % reduction in reporting/decision cycle time
- Data Accuracy = Reduction in reporting errors or reconciliation discrepancies
- TCO (Total Cost of Ownership) = Licensing + Infrastructure + Maintenance + Training
Interpretation
- If ROIbi>1.5 → Tool is typically sustainable for mid-size startups.
- If ROIbi<1 → Implementation likely inefficient or over-budgeted.
In practice, lightweight platforms like Zoho Analytics and Metabase often outperform heavier enterprise suites in this ratio for mid-sized teams due to lower infrastructure costs.
However, at enterprise scale, tools like Microsoft Power BI can outperform in decision speed due to deep integration with enterprise ecosystems.
The key insight: ROI is not about dashboard beauty — it’s about measurable acceleration and cost efficiency.
The 2026 Shift: From Dashboards to Agentic BI
Dashboards are reactive.
Agentic BI is proactive.
Agentic BI systems use AI to:
- Detect anomalies automatically
- Trigger alerts without manual monitoring
- Generate insight summaries
- Recommend actions
Instead of logging into a dashboard daily, executives now ask:
“Why did churn increase in the North region last week?”
And the system responds with charts, causes, and suggestions.
This is powered by Natural Language Querying (NLQ) and AI copilots.
2026 Trend: Natural Language Querying (NLQ)
Modern BI tools increasingly allow users to ask questions in plain English instead of writing SQL.
Two leaders in this space:
- ThoughtSpot
- Looker
With Looker’s integration into Google Cloud’s AI stack, including Vertex AI, users can:
- Type: “Show revenue trends by region for Q4.”
- Instantly generate a visual.
- Receive AI commentary explaining anomalies.
From practical testing, NLQ significantly reduces dependency on data teams. However, accuracy still depends heavily on clean schema design.
NLQ is powerful — but only when your data foundation is disciplined.
Visual Infrastructure: How BI Tools Actually Work (Data Flow Architecture)
A BI tool is only as strong as its data pipeline.
Here’s the simplified data flow model most modern systems follow:
Data Sources
- CRM (Salesforce)
- ERP (SAP, Oracle)
- Marketing platforms
- Web analytics
- Internal databases (PostgreSQL, MySQL)
⬇
Data Integration Layer
- ETL / ELT tools
- APIs
- Streaming connectors
⬇
Data Warehouse / Data Fabric
- BigQuery
- Snowflake
- Azure Fabric
⬇
Semantic Layer
- Business logic definitions
- KPI modeling
- Metric consistency
⬇
BI Tool / Interface
- Dashboards
- NLQ chat
- Embedded analytics
- AI-generated summaries
Without a clean semantic layer, even the best BI tool produces misleading insights.
Updated 2026 Comparison Matrix
| Tool | Primary AI Logic | Best For | 2026 Connectivity |
|---|---|---|---|
| Microsoft Power BI | Copilot (LLM-based) | Enterprise reporting | Native Fabric integration |
| Tableau | Salesforce Einstein | Advanced visualization | Data Cloud sync |
| Looker | Vertex AI integration | Cloud-first startups | Google BigQuery native |
| Metabase | Open-source SQL engine | Budget-conscious devs | PostgreSQL/MySQL native |
| Zoho Analytics | AutoML forecasting | SMB growth teams | 500+ connectors |
| Sisense | Embedded AI insights | SaaS platforms | API-first architecture |
Tool-by-Tool Deep Dive (With Real Experience Observations)
1. Microsoft Power BI
Microsoft Power BI
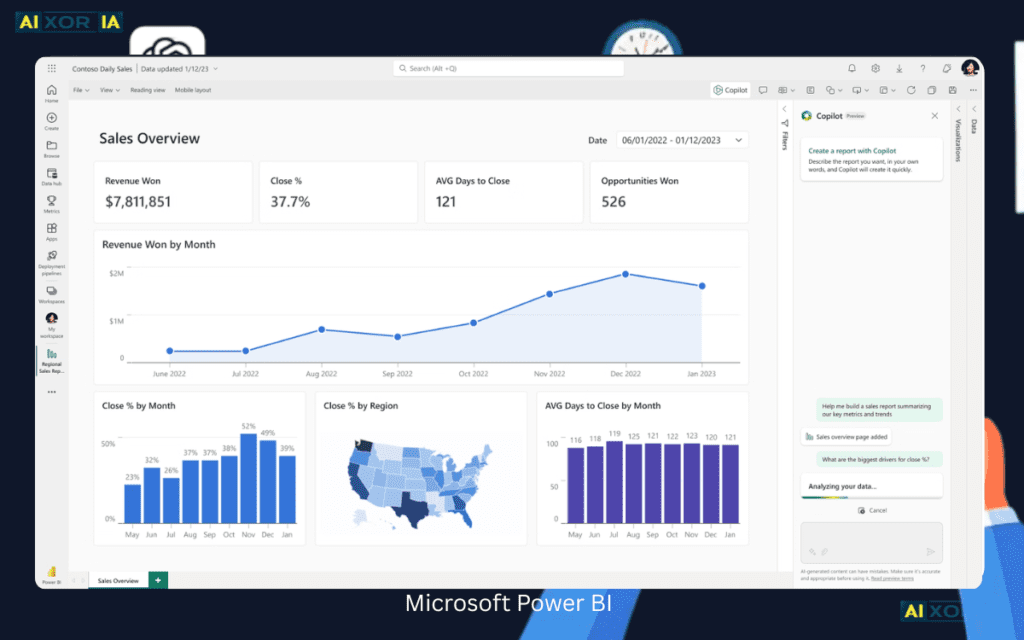
Real Experience Insight
In enterprise environments using Microsoft 365, Power BI feels like a natural extension of Excel — but far more scalable.
What stood out during deployment:
- Fast dashboard creation for finance teams
- Strong governance controls
- Copilot-assisted report generation
However:
- Large dataset optimization requires planning
- Licensing tiers can get complex
Best suited for enterprises already invested in Azure or Microsoft Fabric ecosystems.
2. Tableau
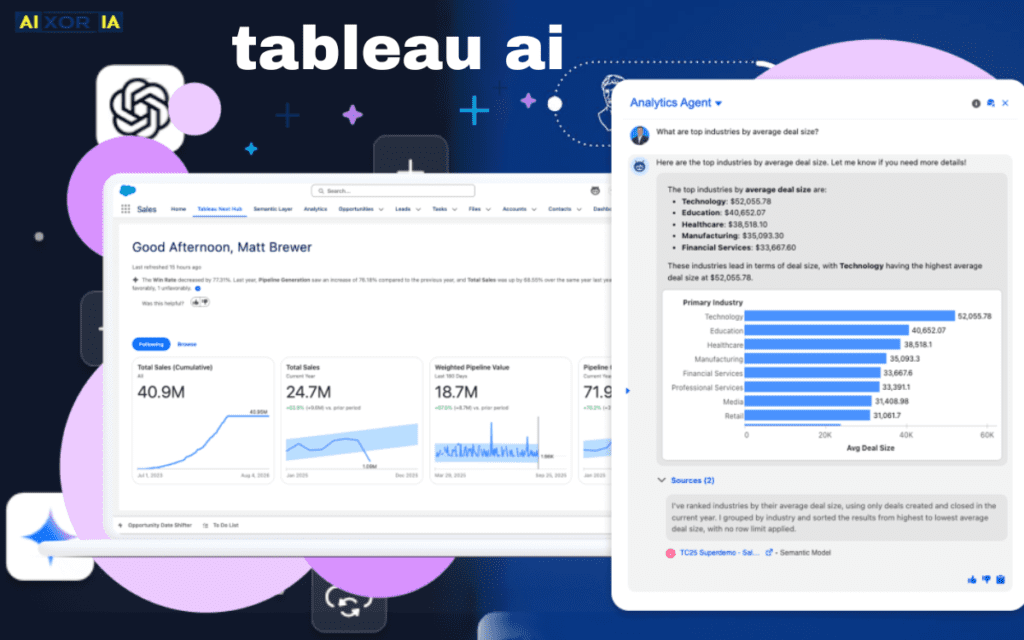
Tableau
Real Experience Insight
Tableau excels in storytelling.
During board-level reporting sessions, its visual polish consistently impressed stakeholders. Advanced visualization flexibility allows complex comparative analysis that other tools struggle to replicate.
But:
- It requires structured data modeling
- Training investment is necessary
- Pricing is premium-tier
Best for organizations prioritizing visual narrative and executive reporting.
3. Looker
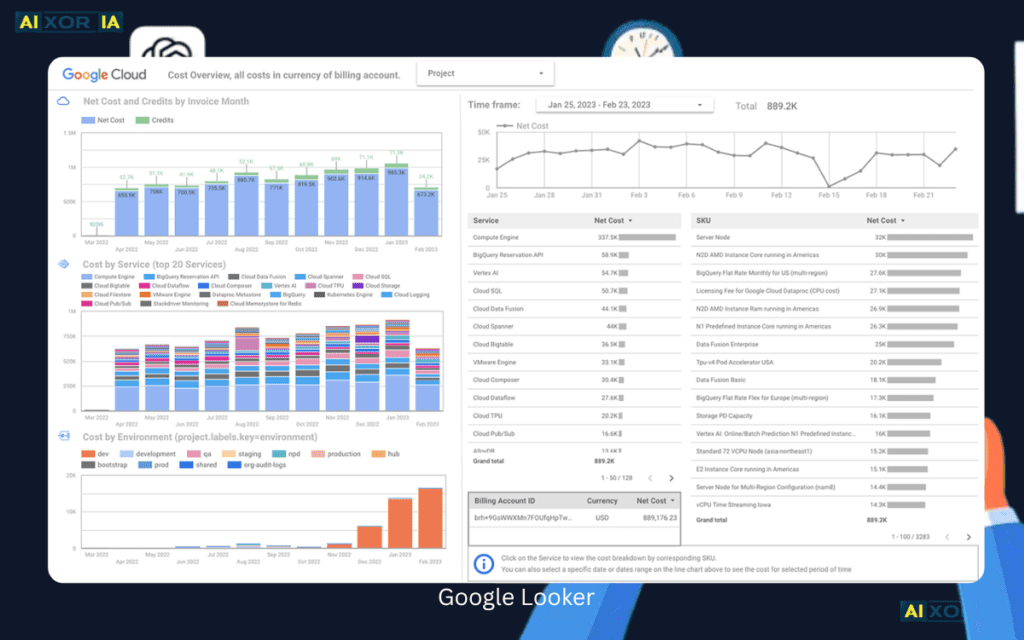
Looker
Real Experience Insight
Looker shines in cloud-native environments.
Its semantic modeling layer (LookML) ensures metric consistency across teams. When combined with BigQuery and Vertex AI, it enables predictive insights directly inside dashboards.
However:
- Setup demands technical expertise
- Initial modeling phase is time-intensive
Ideal for SaaS startups scaling rapidly and managing high-volume cloud data.
4. Metabase
Metabase
Real Experience Insight
For early-stage startups, Metabase is surprisingly powerful.
Deployment on a self-hosted PostgreSQL stack was straightforward. Non-technical team members could generate reports quickly.
Limitations:
- Enterprise governance features limited
- Visualization flexibility not as deep as Tableau
But from an ROI perspective, it performs exceptionally well for budget-sensitive teams.
5. Zoho Analytics
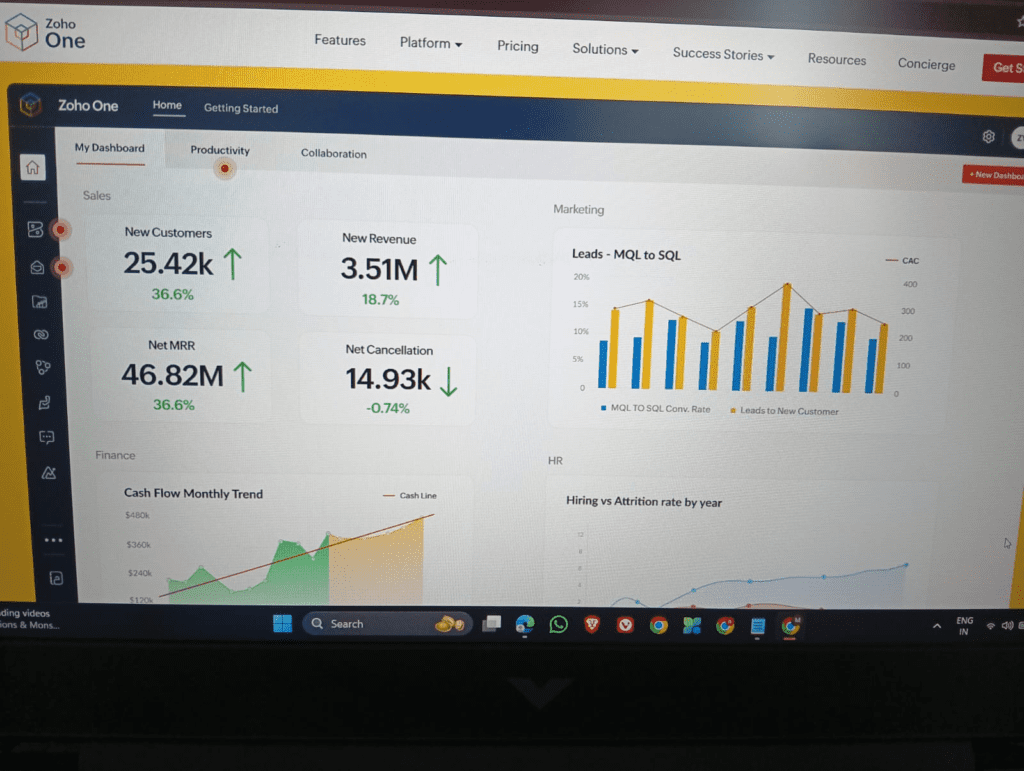
Zoho Analytics
Real Experience Insight
Zoho works well for mid-sized teams needing fast implementation.
Its auto-generated reports reduce setup friction. Built-in forecasting tools are practical for sales trend prediction.
However:
- Complex custom analytics can feel constrained
- Advanced AI features are still evolving
Strong value-for-cost proposition.
6. Sisense
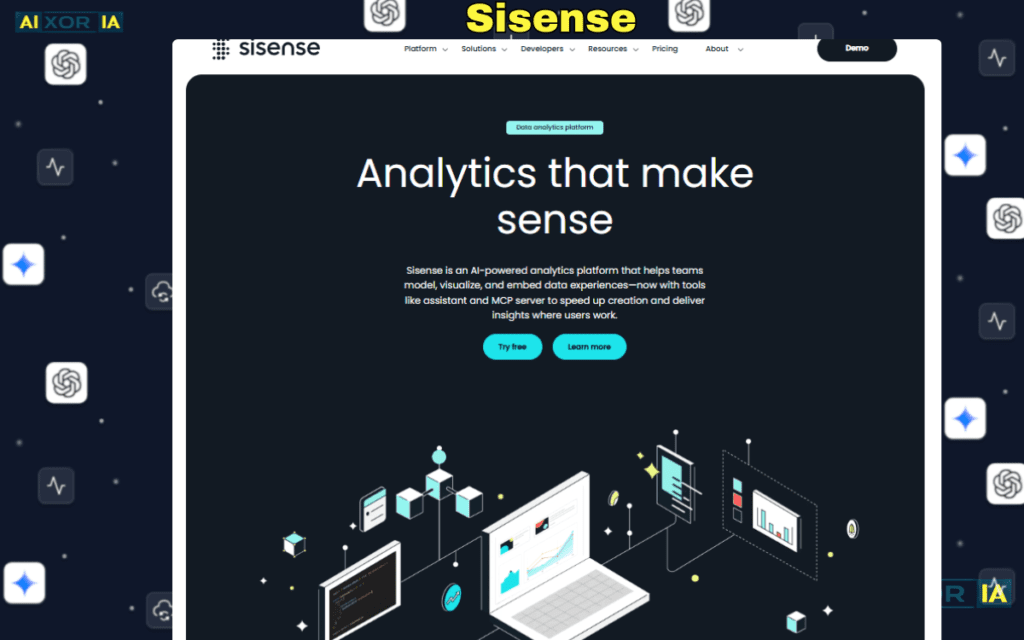
Sisense
Real Experience Insight
Sisense stands out in embedded analytics use cases.
In SaaS environments where dashboards must be delivered inside customer-facing apps, Sisense APIs offer flexibility.
Strength:
- Highly customizable embedding
- Strong performance with large datasets
Challenge:
- Requires engineering involvement
Embedded BI: The Future for SaaS Companies
Embedded BI is no longer optional for SaaS platforms.
Customers expect:
- Personalized analytics dashboards
- In-app data visualization
- Real-time performance tracking
Instead of exporting CSVs, companies now embed analytics directly into their product.
Sisense and Looker lead in this category due to API-first design and scalable cloud architecture.
Embedded BI improves:
- Product stickiness
- Customer retention
- Monetization via premium analytics tiers
Predictive Analytics & Real-Time Data Fabric
Modern BI tools increasingly integrate predictive analytics models.
Capabilities now include:
- Churn prediction
- Revenue forecasting
- Inventory optimization
- Real-time anomaly detection
Data fabric architectures ensure:
- Unified data access
- Cross-platform consistency
- Lower latency analytics
Without real-time data integration, predictive models lose reliability.
Common Implementation Mistakes in 2026
- Buying enterprise BI without defined KPIs
- Ignoring data cleaning before integration
- Overloading dashboards with irrelevant metrics
- Not training teams on NLQ usage
- Underestimating infrastructure scaling costs
The tool is rarely the problem. Data discipline is.
Final Perspective
Business intelligence tools in 2026 are not just reporting platforms. They are decision engines powered by AI, real-time data fabrics, and semantic modeling layers.
The right choice depends on:
- Organizational maturity
- Budget tolerance
- Cloud strategy
- Technical capability
- Long-term scalability goals
Start with clarity. Define metrics. Measure ROI using logic. Then deploy with discipline.
The future of BI belongs to systems that reduce decision latency — not just display charts.
And in that race, Agentic BI platforms are already leading.
1 thought on “Business Intelligence Tools in 2026: From Dashboards to Agentic Decision Systems”